File : Memory status.jpg
Original file (1,517 × 917 pixels, file size: 69 KB, MIME type: image/jpeg)
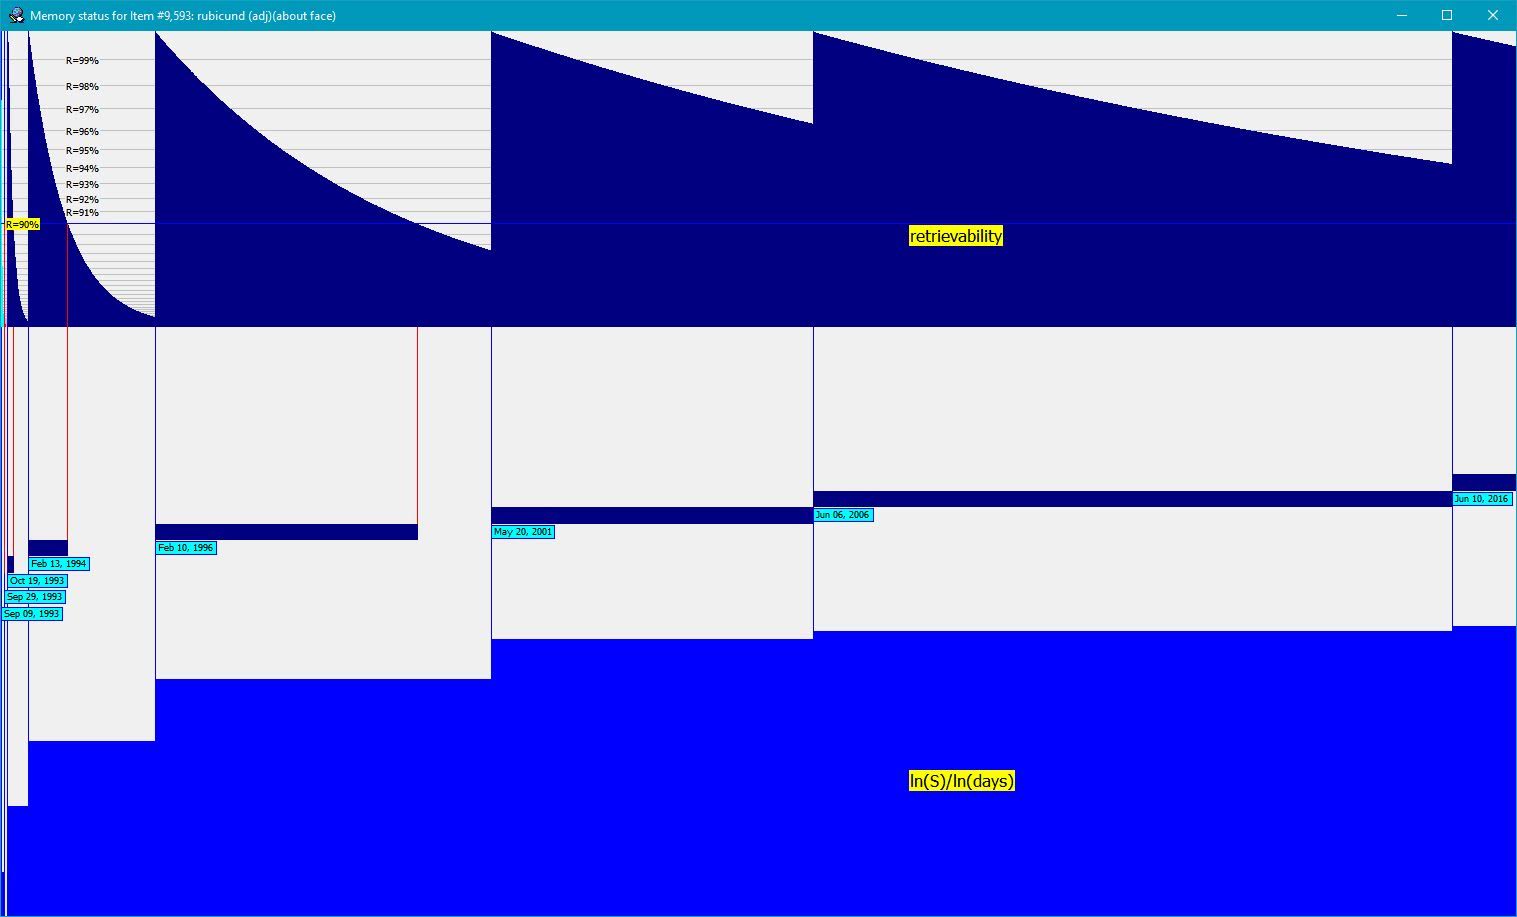
Figure: Changes in memory status over time for an exemplary item. The horizontal axis represents time spanning the entire repetition history. The top panel shows retrievability (tenth power, R^10, for easier analysis). Retrievability grid in gray is labelled by R=99%, R=98%, etc. The middle panel displays optimum intervals in navy. Repetition dates are marked by blue vertical lines and labelled in aqua. The end of the optimum interval where R crosses 90% line is marked by red vertical lines (only if intervals are longer than optimum intervals). The bottom panel visualizes stability (presented as
ln(S)/ln(days)for easier analysis). The graph shows that retrievability drops fast (exponentially) after early repetitions when stability is low, however, it only drops from 100% to 94% in long 10 years after the 7th review. All values are derived from an actual repetition history and the DSR model.
File usage
The following 5 pages use this file: